
1
Set the scene
Start with context
Fill the frame
2–3 ft for close-ups; keep ladders, cords and workers fully in view.
Safety photo analysis is an AI review of a workplace photo for visible hazards. Upload a picture — a warehouse aisle, a dock, a work area — and the analysis identifies each hazard it can see: spills in pedestrian lanes, leaning or unstable stacks, blocked equipment, cord conditions, missing PPE. Every finding comes back with the OSHA standard it may relate to, why it matters, a suggested fix, and a confidence level, plus a 0-100 score for the area. It runs in seconds and is free to try with no account. It analyzes what is visible in the frame — a person verifies findings and covers the rest.
Free · No account needed to scan · Results in seconds
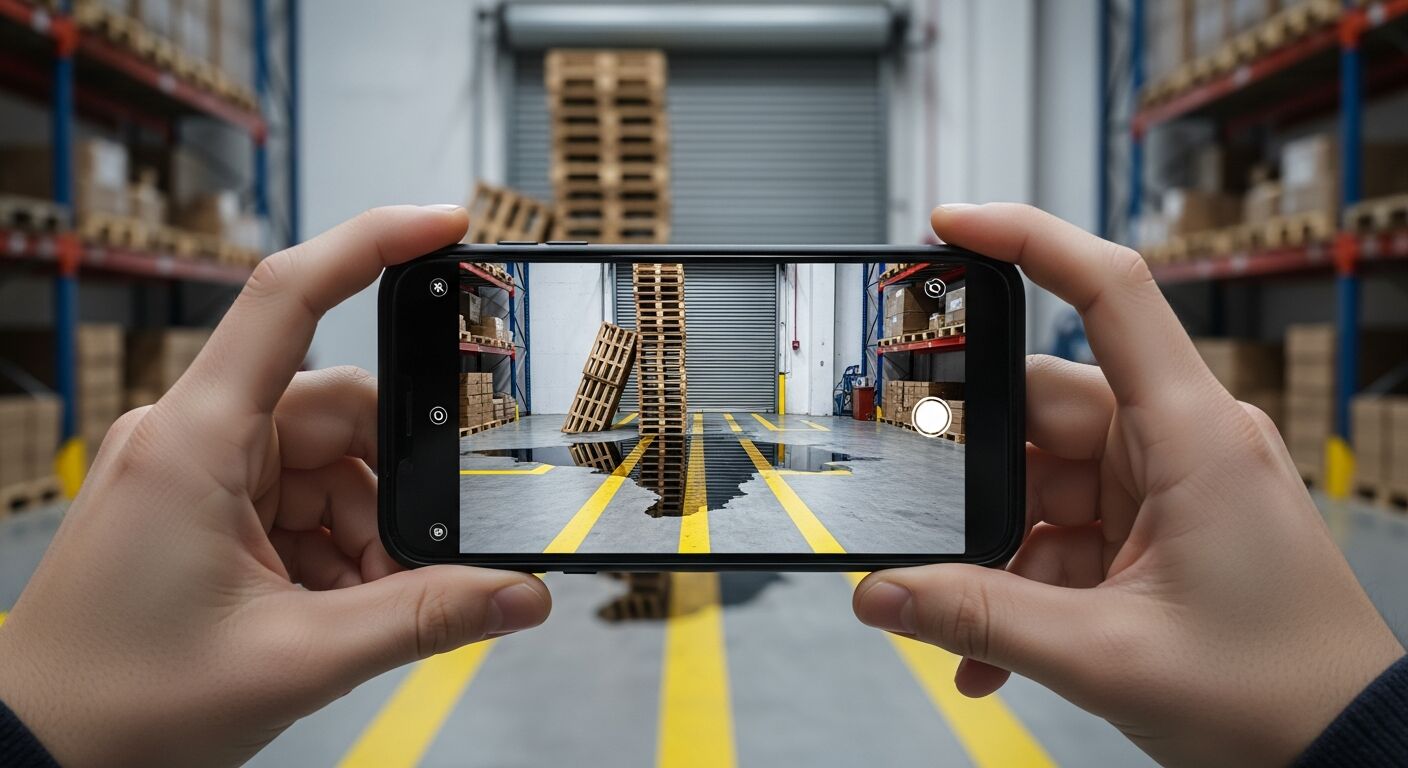
A photo of a hazard is not a safety record — it is a reminder that depends entirely on who looks at it and what they know. The spill photographed at shift change gets texted to a group chat, reacted to, and forgotten; the leaning pallet stack in the background of a progress shot never registers at all. The information was captured. The analysis never happened.
Running the photo through analysis converts it: each visible hazard is named, referenced to the OSHA standard it may relate to, weighted by severity into an area score, and paired with a suggested correction. The person who took the picture gets a decision-ready finding list in the time it took to walk to the next aisle — and the findings they accept become assigned corrective actions with owners and dates instead of a group-chat reaction.
Analysis also makes photos comparable. One picture is an anecdote; the same dock analyzed weekly is a trend line. When the score drops, something changed on the floor — and the finding list says exactly what.
Computer vision models trained on workplace safety imagery can identify patterns associated with common OSHA-cited hazard conditions — blocked exits, spills in pedestrian lanes, unstable storage, open electrical panels, missing guards, PPE gaps — with a consistency that does not vary by shift, fatigue level, or how familiar the reviewer is with the space. This is the core advantage of AI-based photo analysis over human memory-based inspection: the model has no familiarity bias, no habit of looking past conditions that have been present for weeks without incident, and no variability in what it chooses to flag based on the time of day or how many other items are on the inspector's checklist.
The limitation is the inverse of the strength: AI vision only processes what appears in the image frame. Hazards behind racking, in motion, below grade, or outside the photographed area are invisible to the analysis. Every safety photo analysis result should be read as 'these are the visible conditions in this frame at this moment' — not as a comprehensive assessment of the work area. The value is in the systematic, bias-free recognition of visible conditions; the human reviewer adds context, physical verification, and coverage of what the camera cannot see.
A single safety photo analysis is a snapshot; a series of analyses of the same area over time is a trend line. OSHA's inspection data and academic safety research both show that workplaces with the lowest incident rates share a common characteristic: they measure safety conditions frequently, consistently, and in comparable units that allow them to track whether things are getting better or worse. A weekly scored analysis of the same dock, the same aisle, or the same machine area produces exactly this kind of comparable data — the score is the same metric applied the same way each week, so a drop in the score has a specific meaning and the finding list shows exactly what changed.
For EHS managers reporting to leadership, scored trend data also solves a communication problem. Describing safety compliance in qualitative terms — 'conditions have improved since the last walk-through' — is unconvincing and unfalsifiable. A chart showing the compliance score for four work areas over twelve weeks, with corrective-action closure rates, is the kind of leading-indicator data that safety professionals have traditionally struggled to produce without expensive software. Photo analysis at the frequency enabled by a mobile tool makes this data practically achievable without dedicated safety staff for every location.
Every visible hazard family, weighted into one score — this is what the AI reads out of the frame.
Liquid across walking lanes, wet process areas without controls, and the floor-level conditions behind most slip injuries.
Leaning pallet stacks, unbanded loads, overloaded or damaged racking, and material staged where it can fall on people.
Obstructed marked lanes, blocked exits and aisles, and pedestrian routes that cross equipment traffic without separation.
Each finding is weighted by risk into a 0-100 area score with a confidence level per finding — so the number tracks what matters most.
Scan a photo like the one above and this is the report you get — score, findings, OSHA references, and fixes. It is an illustrative example, clearly marked — not live scan data.
Compliance score
44
Lower means more potential hazards found
5 potential hazards found
1Liquid spill spreading across the marked pedestrian lane
HighPossibly related to walking-working surface condition (29 CFR 1910.22)
Observed condition: A spill inside the marked walking lane is aimed at exactly the place people are told to walk — same-level slips are among the most common lost-time injuries in warehousing.
Corrective action: Barricade the lane, clean and dry the spill, and trace the source before releasing the path — a recurring drip needs a fix, not a mop schedule.
High confidence
2Tall pallet stack leaning beside the roll-up dock door
MediumPossibly related to material handling and storage (29 CFR 1910.176)
Observed condition: A visibly out-of-plumb stack in a dock's traffic and vibration zone is a tip-over waiting for one more forklift pass — and dock doors concentrate people around it.
Corrective action: Break down the leaning stack, cull damaged pallets, and keep empty-pallet stack heights within what the footprint holds stably.
High confidence
Upload a photo like the one above and get a compliance score and hazard count in seconds. No account needed to scan — create a free account to unlock the full report.
Use the real site or facility name. If you save the scan after signup, it becomes the report name.
Three angles, one deeper scan
Only the wide shot is required — every extra angle gives the AI more places to look.
Required: Set the scene — one wide shot lets the AI sweep the whole area at once
Stand at the entry point and capture corner to corner: floors, ladders, scaffolds, and everyone at work
Drop a job-site photo or walkthrough video
Click to upload, drag & drop, or snap a photo on site. Photos scan free in about 15 seconds — no signup, no card. Video walkthroughs (up to 3 min) run on a free account.
Small habits, sharper scans
Set the scene
Start with context
Fill the frame
2–3 ft for close-ups; keep ladders, cords and workers fully in view.
Capture clearly
Make the frame usable
Light it right
Keep the sun or lights behind you — glare and shadows hide hazards.
Tap to focus
Tap the hazard on screen and hold still one second — blur can't be flagged.
Choose the useful view
Give the AI room to understand
Go landscape
Turn your phone sideways — a wider frame catches more of the scene.
Only upload photos you have permission to use, and avoid images showing personal, customer, or confidential information. Demo photos and results are held privately for up to 48 hours so you can save them to a free account; unclaimed photos are deleted automatically. Results are an AI-assisted preliminary review, not an official OSHA determination.
New: Video walkthrough scans
Record up to 3 minutes of your site — the AI extracts frames and flags every hazard with exact timestamps. Free account required.
Get the best results
Wide shot first
Stand at the entrance and photograph the entire work area so AI sees the full context
Hazard areas
Photograph elevated surfaces, equipment, electrical panels, and anywhere workers are active
Close-ups last
Move in close on anything damaged, missing, or that looks risky — the AI catches more detail
How to read, verify, and act on an AI photo analysis so the findings turn into fixes. The first four points are free — create a free account to unlock the full checklist and start analyzing your own photos.
Read the score as a snapshot, not a verdict
The 0-100 score grades the visible conditions in one frame at one moment — it is a comparison tool across areas and weeks, not a compliance rating.
Start with the highest-severity finding
Findings are weighted by risk; the top one or two drive most of the score, and fixing them first moves both the number and the exposure.
Check the confidence level on each finding
High-confidence findings are usually visible outright; lower confidence flags something worth a look in person before you assign a correction.
Walk to every flagged location
Analysis is a draft. Confirm each finding in context — the 'spill' may be a shadow, or the shadow may be hiding a bigger spill.
OSHA Scan reads a single photo. That makes it fast and easy for anyone on site — but it also means it has real limits. Here's an honest look at both.
A scan is a fast first look, not the final word. Before treating this kind of area as safe, a competent person should still confirm:
It is an AI review of a workplace photograph for visible safety hazards. The analysis names each hazard it can see, references the OSHA standard it may relate to, suggests a correction, assigns a confidence level, and rolls the findings into a 0-100 score for the area. A person then verifies the findings on site.
It is strongest on clearly visible, common conditions — spills, blocked paths, unstable storage, open panels, missing hard hats — and each finding carries a confidence level so you know which ones to double-check. It only sees what is in the frame, which is why every finding says 'possibly related to' a standard and a person makes the final call.
Verify each one at the location, dismiss what does not apply, and convert the rest into corrective actions with owners and deadlines — the report tracks them as a checklist. Re-scan after the fixes to close the loop with dated evidence.
Yes to try: upload a photo and get the score and hazard count with no account. A free account unlocks the complete finding-by-finding analysis with OSHA references and corrective actions, plus 5 free scans, saved history, and PDF export.
Reviewed by OSHA Scan Editorial
Last updated August 29, 2026
This content is produced by the OSHA Scan Editorial team and reviewed with AI assistance. It is general safety information, not legal or compliance advice. OSHA Scan is an independent tool and is not affiliated with, endorsed by, or certified by OSHA or the U.S. Department of Labor.
Free PDF checklist
33 critical checks across 7 categories — the same visible gaps the AI scanner looks for. Sent to your inbox as a free PDF.
More ways to see what an AI OSHA scan can do for your site.
The overview hub — how the scanner works and every job, site, and hazard it covers.
The camera-first inspection walk for construction sites.
Start the job hazard analysis from a picture, not a form.
The vision pipeline behind every analysis.
Detection tuned to floor-level hazards in a photo.
Obstructed exits, egress paths, and cluttered walkways.
See a complete labelled example of everything a scan returns.
Start with 5 included AI site scans plus a one-time 10-scan signup bonus — no credit card. Build JHA-ready reports and catch changing conditions sooner.
Start your free trial